Sentiment Analyis of London AirBnb

Background
Airbnb was founded in 2007 when two Hosts welcomed three guests to their San Francisco home and has since grown to 4 million Hosts who have welcomed more than 1 billion guest arrivals in almost every country across the globe (Airbnb, 2022). Airbnb has successfully disrupted the traditional hospitality industry as an increasing number of travelers, not just those looking for a good deal, but also business travelers, use Airbnb as their primary lodging source. The platform also allows homeowners to make some extra cash by renting out a room or property to visitors, and this is certainly the case in London where the amount of properties has dramatically increased.
The beautiful capital city of England & United Kingdom – London, is one of the most visited cities in the world. Despite the restrictions implemented amidst the pandemic, this city remains to be one of the most popular destinations visited by numerous travellers across the globe. Relatively, as travellers look for their ideal place to stay in London, the demand for Airbnb is expected to rapidly increase. According to property management, over 50% of guests prefer to stay at an Airbnb than a traditional hotel for various reasons and an experienced host can earn an average of $10,000 annually.
While this may sound enticing to Airbnb hosts who would like to invest their time and money, we must keep in mind that some neighbourhoods may not offer an equal amount of return on investment.
AirBnb has become a dominant participant in the online-rental marketplace industry, as tourists and business visitors, among others, use it to rent rooms, apartments, and other available homestay accommodations. The company was a pioneer in creating Homestay as a popular style of hospitality and lodging in which travelers share a home with a native of the city they are visiting for a pre-arranged period. Due to its popularity and reach out in the tourist and hospitality industries a huge amount of data is generated daily. The organization has accumulated massive amounts of information from the cities in which it operates, including user reviews, location descriptions, and rental statistics. Respectively, this project shows exploratory data analysis, visualizations, dashboard, reports, interactive charts, and many other fascinating insights into the Airbnb dataset of London.
Introduction
The very first step to start this project is to brainstorm and plan how the project will be completed and what kind of solutions this project can bring into action. Then brief research on AirBnb and especially of the London area is done. We'll be looking at a dataset that is freely available. To handle this data effectively, we'll utilize Pandas and NumPy, a Python data manipulation and analysis toolkit that offers data structures and methods for manipulating numerical tables and time series. In a similar vein, we will investigate data analytics and visualization methods utilizing the Python programming language. Likewise, a real time dashboard will be built using Tableau to demonstrate the data into easily understandable insights.
Using text mining and sentiment analysis to study a "big data" set of online review comments, we will look at the aspects that affect Airbnb users' experiences. This study provides a unique viewpoint and a more thorough analysis of the Airbnb experience. By illustrating how big data can be utilized and visualized in tourism and hospitality research, it offers a methodological contribution.
Most of the Airbnb and any hospitality business only shows reviews, positive comments and good ratings in their websites. This analysis will help them to identify the location with the positive, or negative or neutral comments and they can make their stay secure and delightful.
The London Airbnb dataset for this study was obtained from the Inside Airbnb website “Inside Airbnb: Get the Data”, which allows researchers to access publicly available Airbnb data for research purposes, as well as data from numerous previously published Airbnb-related studies. This website stores the data of AirBnb worldwide and to perform the analytics on London City AirBnb, London city was filtered and downloaded the dataset till 09 March 2023. The link to this website is Inside AirBnb: Get the Data.
Aim:
To find out where in London hosts have the most positive and negative reviews and provide appropriate suggestions to improve the negative comments.Objectives:
1. To analyze the London AirBnb datasets2. To build a sentiment classifier, creating the labels from the files positive.txt and negative.txt.
3. Do appropriate descriptive and diagnostic analysis of the data.
4. To analyze the sentiment of Airbnb users in London based on their comments and reviews.
Exploratory Data Analyis
From the Figure 10, we can see that there are 75241 number of Airbnb properties with 4 room types in 33 different locations inside London where the average review is 17.97%. On average, each property in London has received approximately 17.97% reviews.
There are in total 47619 number of individual hosts where the total number of Airbnb listing is 75241. Some of the hosts have multiple Airbnb hosting.
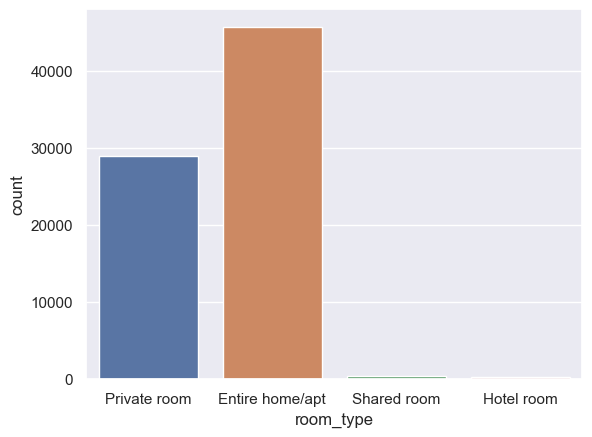
There are 4 types of rooms are sold in Airbnb London where the Entire Home/Apartment has 45714 number, Private Rooms are 28910, Shared Rooms are 403 and Hotel Rooms are 214 in number. We can see that mostly the Entire Home and Apartment are famous for Airbnb followed by the Private Rooms.
Which place in London provide more AirBnb facility?
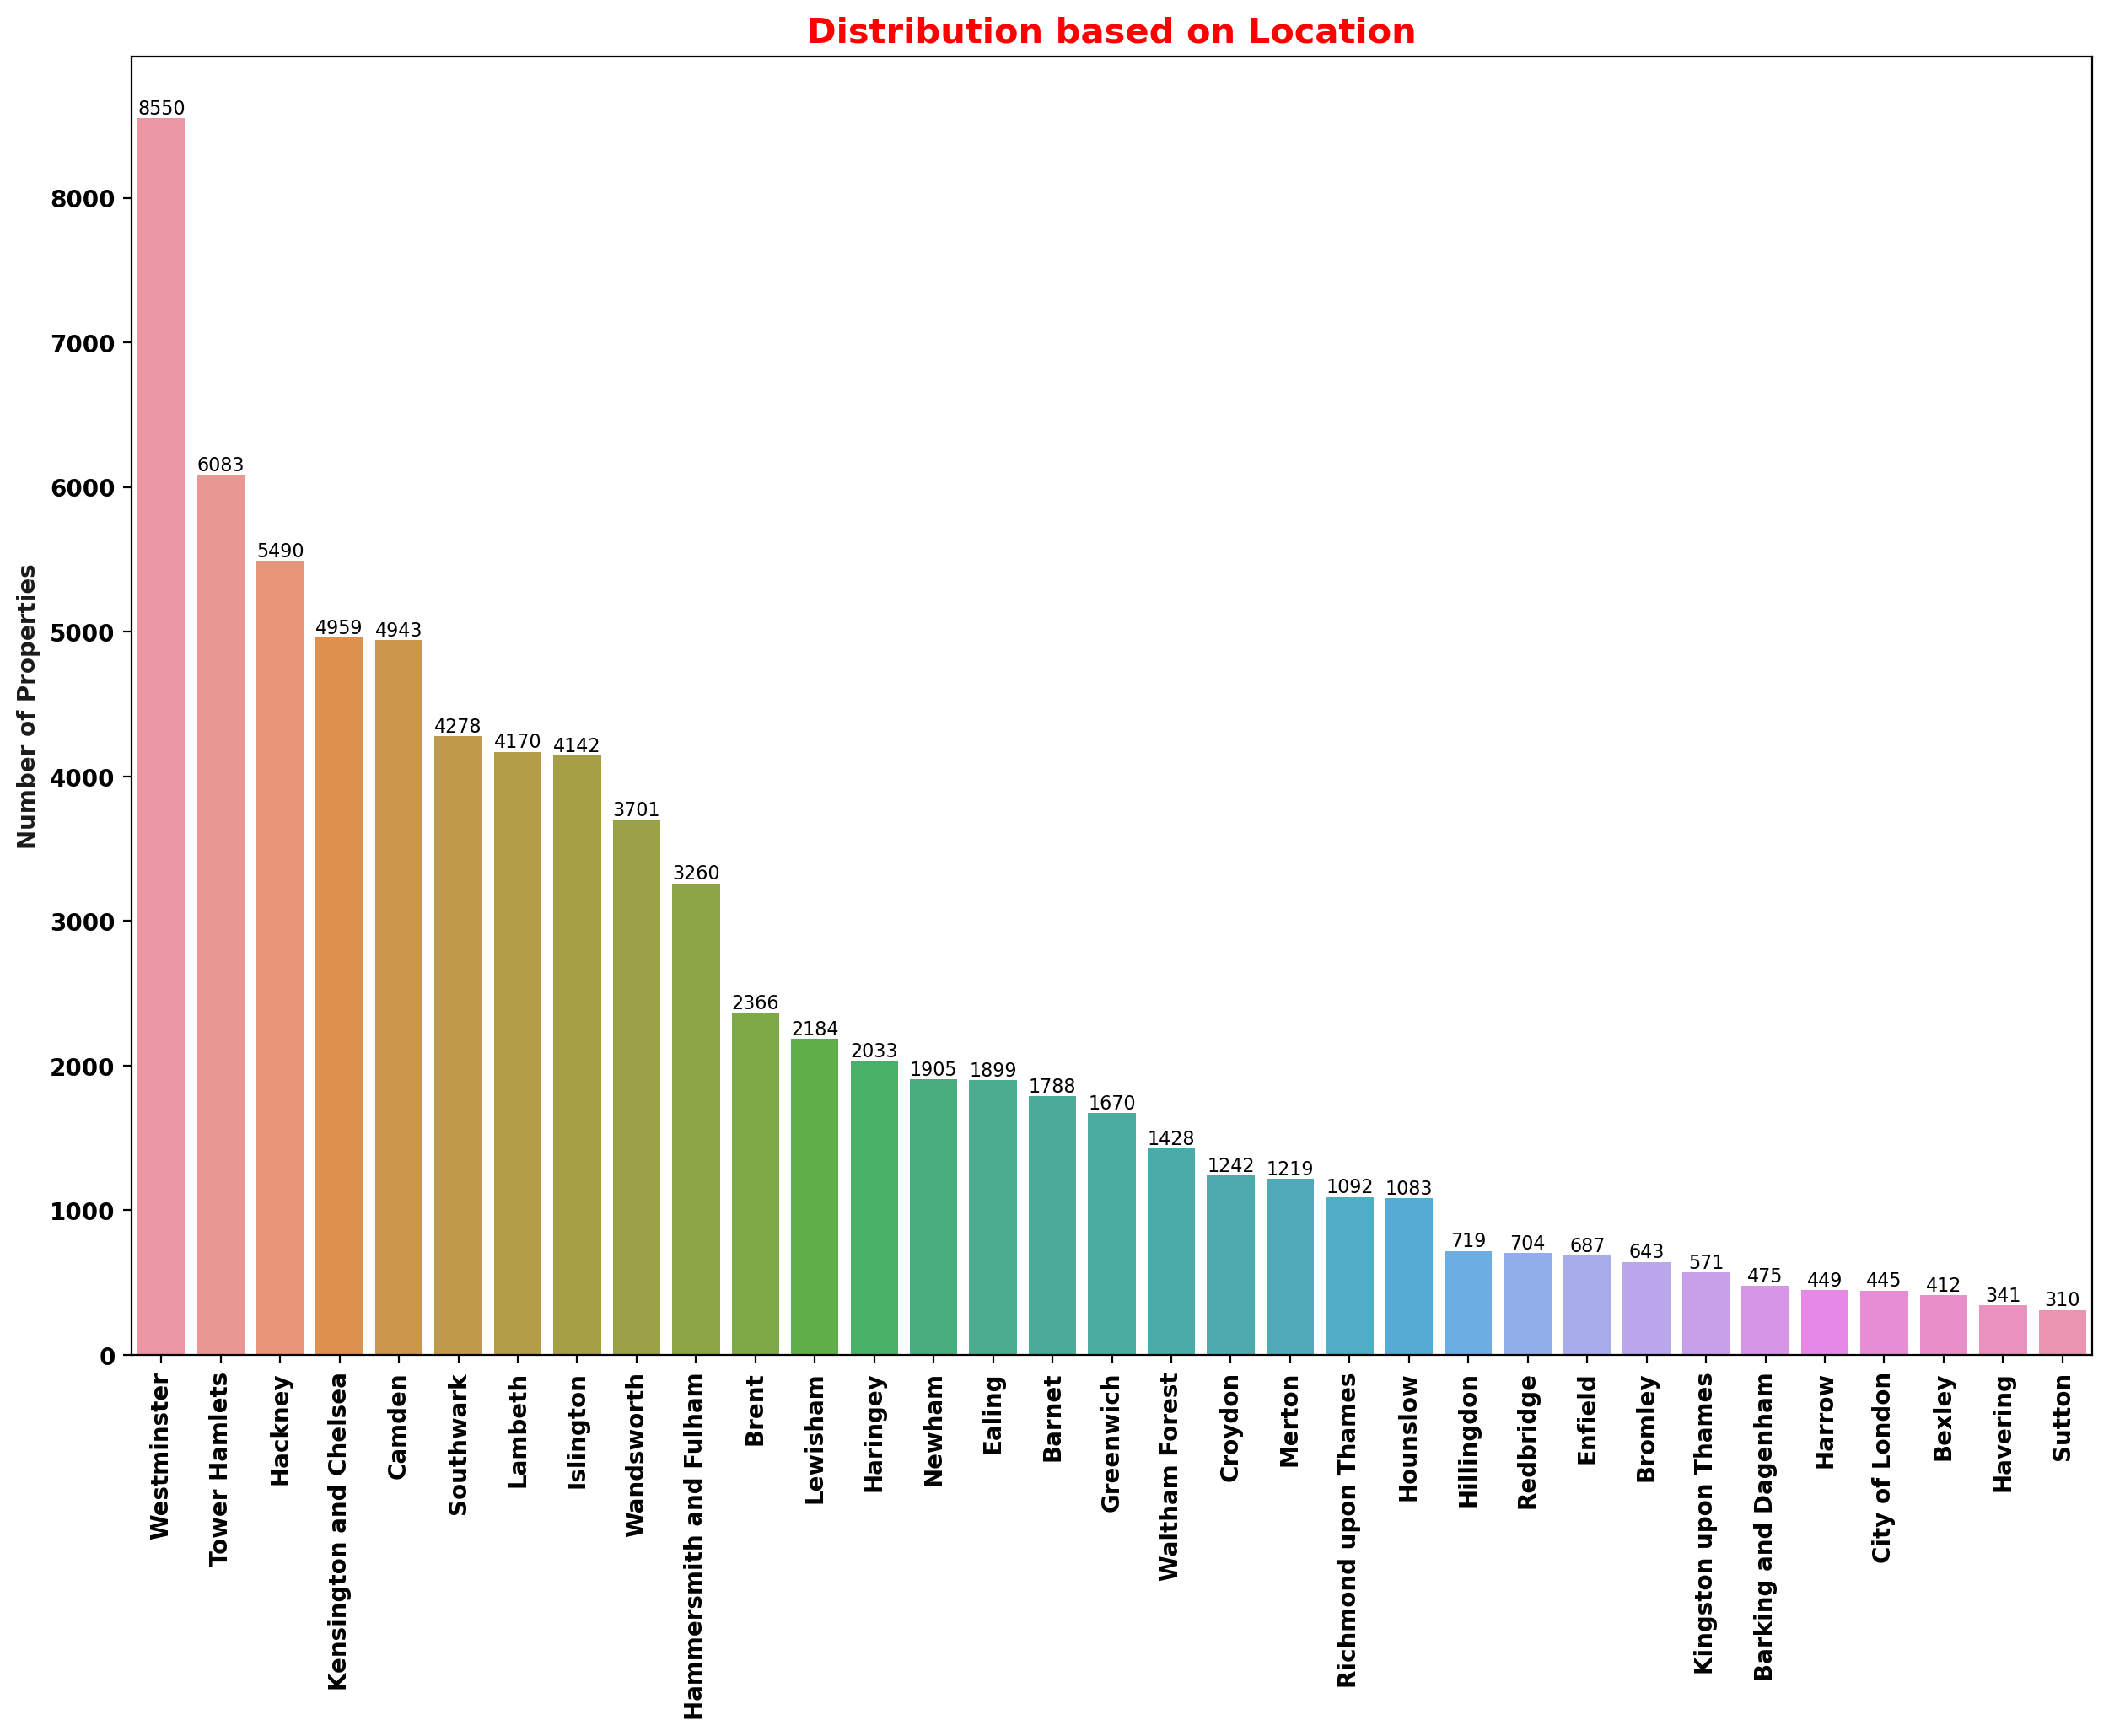
Till 09 March 2023, Westminster is the busiest Airbnb area inside the London followed by Tower Hamlets and Hackney whereas the Sutton and havering are the less crowed places for Airbnb.
Which location has the highest availability?
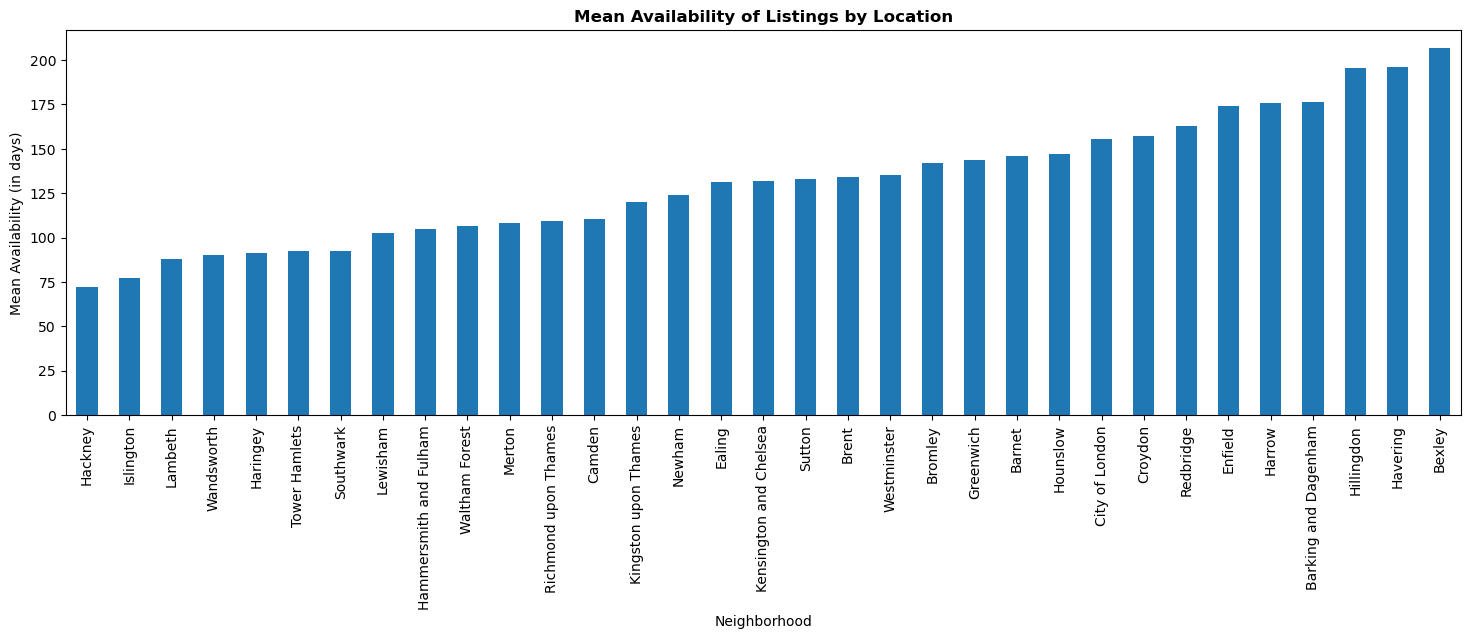
Though there are many AirBnb properties inside the London, some of them are available frequently and some of them mostly. Based on the availability, Bexley and Havering are best options to stay and Hackney and Islington less available.
Which area are mostly expensive?
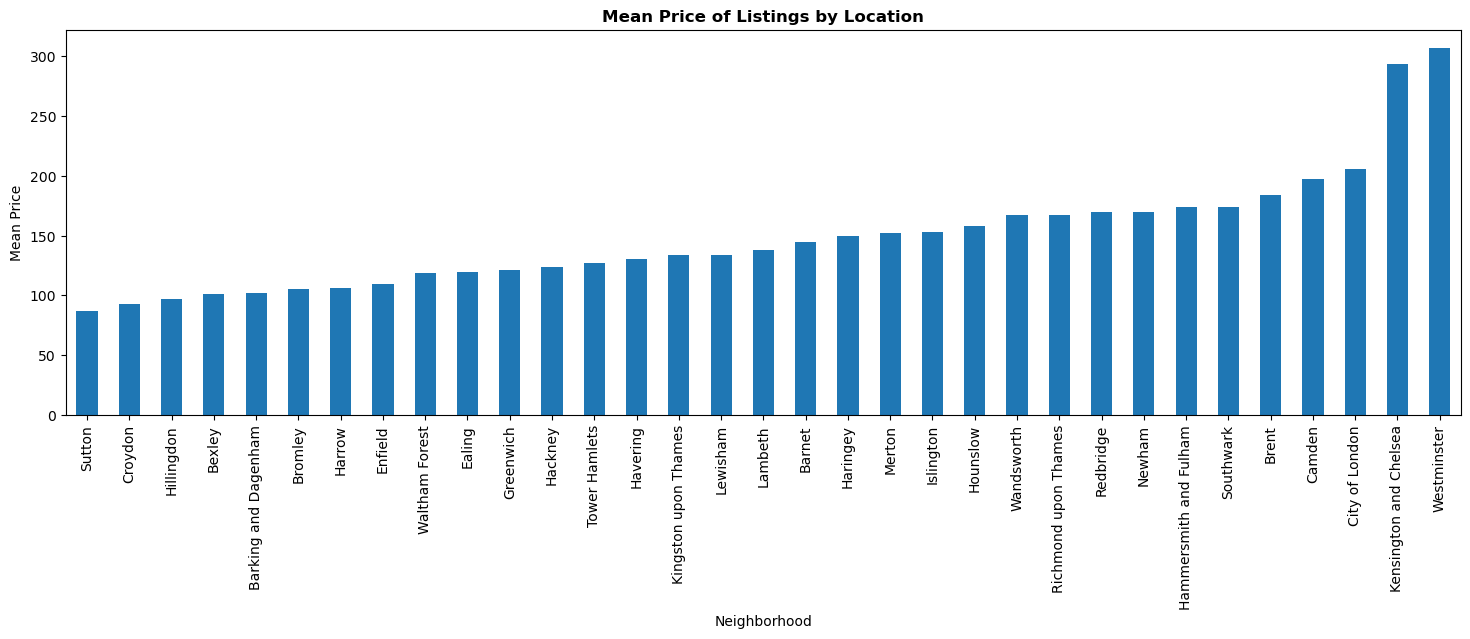
Westminster, and Kensington are bit expensive as compared to other areas and Sutton, Croydon and Hillington have less room price as compared to other areas.
Which month has the highest reviews?
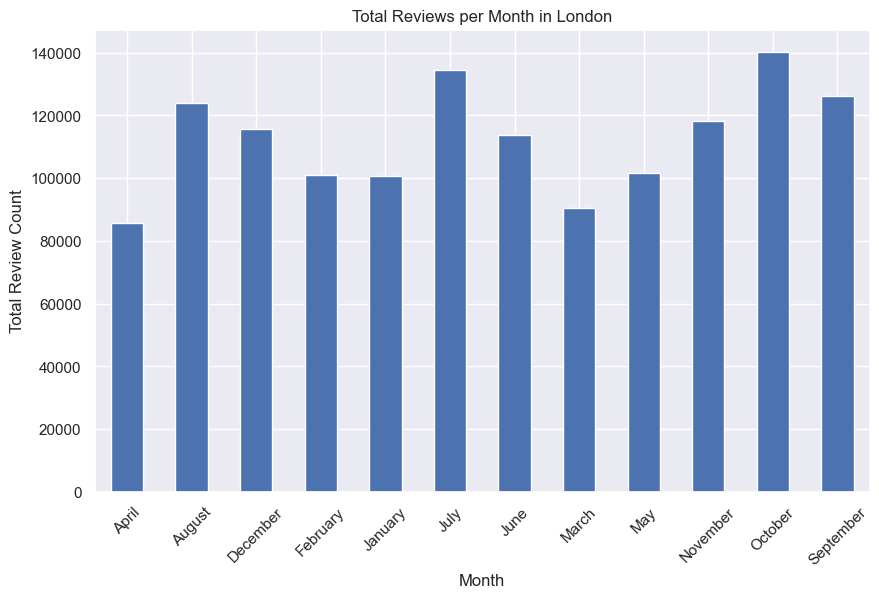
Based on the bar graph, November and July are gathering more reviews whereas April and March have less reviews.
What are the most used words?
The diagram shows a bar plot showing the frequency distribution of the top 5 most common words in the tokenized reviews where "great" a positive sense of word has the highest counts.
Now, the word cloud visualization is generated based on the frequency distribution of words in the tokenized reviews. The word cloud represents the most common words, with the size of each word indicating its frequency of occurrence. Stop words are excluded from the word cloud to focus on meaningful words.
We can see how word clouds can help users quickly identify the most common tokens in each feature. We can discover frequent terms that appear repeatedly by dividing each string down into individual components. "clean" "great" and comparable qualifiers are, unsurprisingly, the most used across categories. Finally, the comments of the listings review on Airbnb. If we're deciding where to stay based on budget, we might want to check out the neighbourhood reviews. We use the review dataset to see how many good and bad comments there are about the areas. To begin, we look for reviews in English to examine. We then used the NLTK package to do sentiment analysis to determine whether a comment is good or negative.
Location with the Positive Comments:
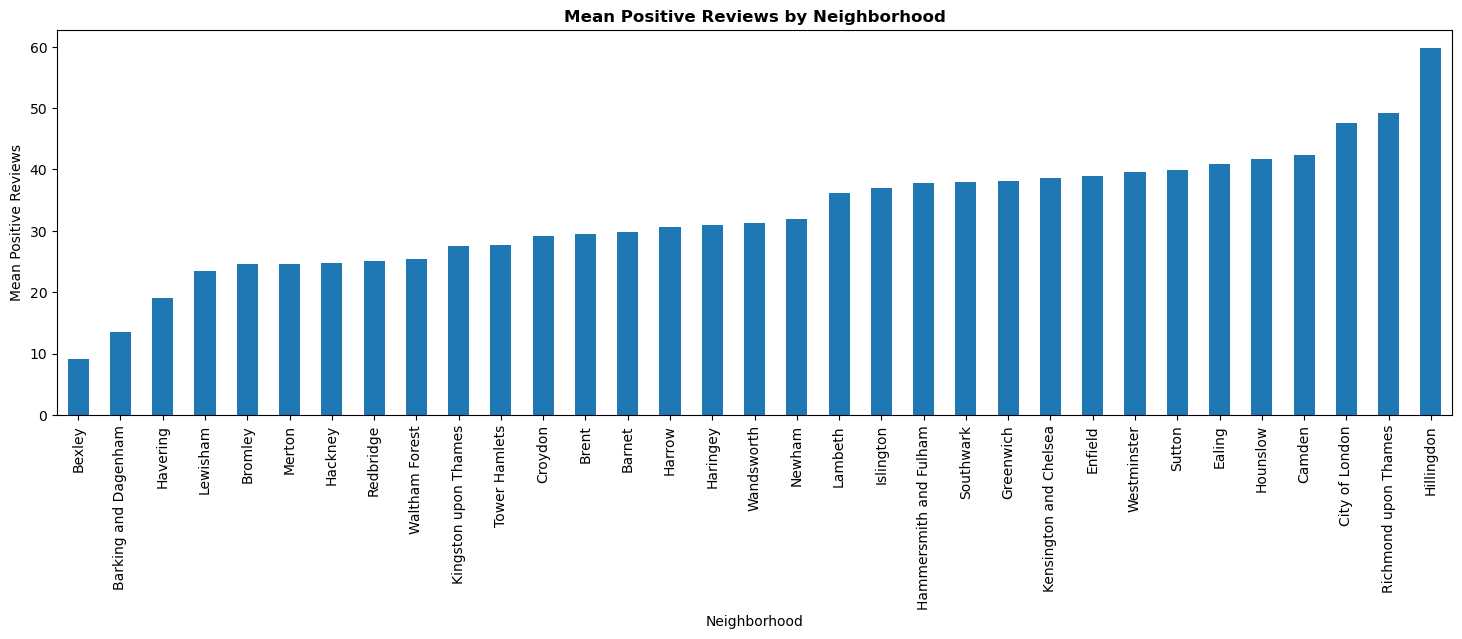
From the Figure, we can see that Hillingdon and Richmond upon Thames has the highest positive comments so far. So, the visitors now can make their decision in which locations they can secure and enjoy their stay.
Location with the Negative Comments:
From the above diagram, City of London and Southwark has the highest negative reviews.
Conclusion
We identified sources of pleasure and unhappiness among Airbnb consumers in our research. Airbnb customer review studies showing the positive and negative ratings, this study employed equal numbers of positive and negative reviews. Using Python to analyse Airbnb listings and reviews data to build informative charts. When planning a trip to London, one can choose a neighbourhood by looking at average costs, remarks, availability. Following that, we looked at borough and neighbourhood listing densities to see which locations were more popular than others. The more central areas of London we look for Airbnb, the more expensive are the listings. As we know that the neighbourhood group column has no values if there has been data it would have been much easier to develop a good visualization as taking whole neighbourhood column for visualization was hard because there were 30+ area listed which made difficulty in plotting the graph. According to the findings Airbnb in London is doing well we can see that as huge number of positive review additional attributes. It would also be useful to have a few of extra characteristics for our data exploration purposes, such as positive and negative numeric 0-5 stars reviews for each listing; having this information would aid in determining the best-reviewed hosts. Overall, we uncovered many intriguing feature connections and detailed each stage of the approach. This data helps organization make better business choices, platform control, marketing activities, new product implementation, and much more.